Build an AI-Powered Market Risk Control Cockpit with Python and AI
- Build an AI-Powered Market Risk Control Cockpit with Python and AI
- Introduction
- Solution Architecture
- Build the Project
- Step 1 — Create the Market-Risk Datasets
- Step 2 — Validate the Data and Engineer Features
- Step 3 — Apply Deterministic Rules
- Step 4 — Detect Statistical Anomalies with Isolation Forest
- Step 5 — Add Market Context and Explainability
- Step 6 — Estimate Financial Impact
- Step 7 — Prioritise Alerts by Business Risk
- Step 8 — Generate an AI Investigation Report
- What AI Adds—and What It Does Not
- Try It Yourself
- Real-World Applications
- Limitations and Ethical Considerations
- Where to Go Next
Introduction
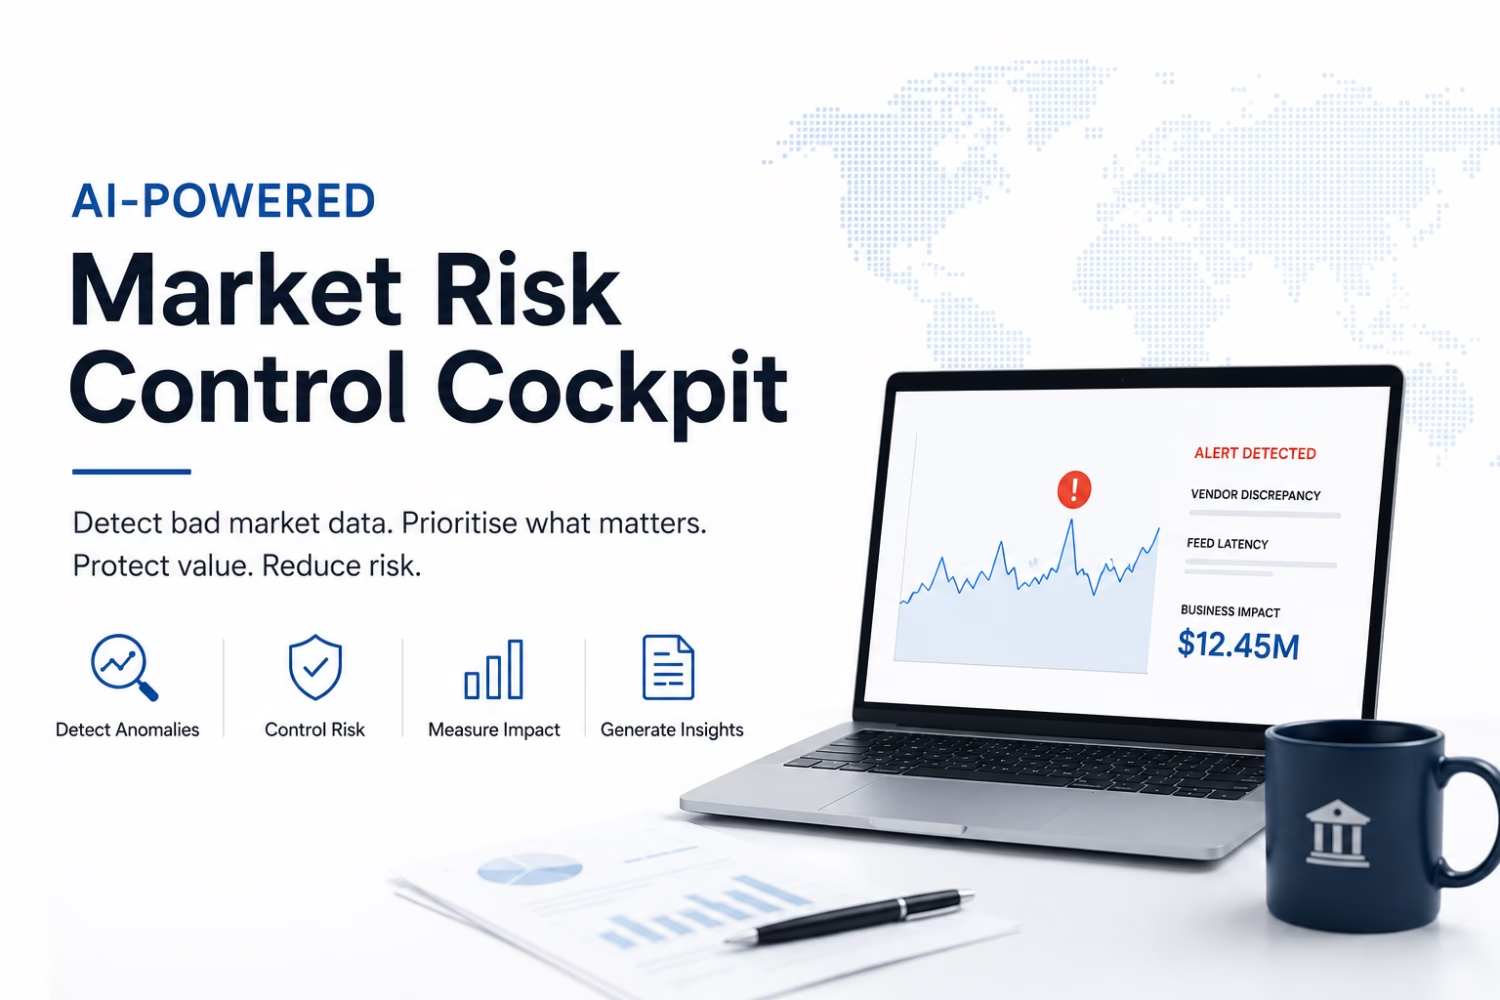
Learn how financial institutions can detect unreliable market data, estimate its business impact, prioritise investigations, and generate analyst-ready incident reports using Python, machine learning, and generative AI.
A single incorrect exchange rate can affect trading decisions, portfolio valuations, profit and loss, risk calculations, regulatory reporting, and capital allocation.
The problem is not that banks lack controls.
The problem is that those controls can generate thousands of alerts—and analysts must still decide which ones matter.
In this hands-on project, we will build an AI-powered Market Risk Control Cockpit for foreign exchange data. It combines deterministic validation rules, anomaly detection, portfolio exposure, scenario analysis, and a large language model to convert raw alerts into prioritised investigations.
Although the demonstration focuses on foreign exchange rates, the architecture is reusable. By adding asset-specific rules and connecting new data feeds, the same control framework can monitor fixed income, equities, commodities, credit spreads, derivatives, and other market-risk inputs.
What You’ll Build
The code is available in Github : AI-Powered Market Risk Control Cockpit.
By the end of this tutorial, you will understand how to build a system that can:
✔ Monitor prices from multiple market-data vendors
✔ Detect stale, delayed, missing, or conflicting observations
✔ Use Isolation Forest to discover unusual market behaviour
✔ Add market context and historical evidence to alerts
✔ Estimate scenario-based portfolio impact
✔ Prioritise incidents according to business risk
✔ Generate an investigation report with a large language model
✔ Present the results in an interactive Streamlit dashboard
Imagine This…
Imagine you are a market-risk analyst at a global bank.
Every few seconds, thousands of prices arrive from market-data providers, trading venues, and internal systems.
These prices influence:
- Foreign-exchange trading
- Bond and derivative valuations
- Daily profit and loss
- Risk sensitivities
- Value at Risk
- Stress testing
- Regulatory capital
- Client and management reporting
Now imagine one price is wrong.
EUR/USD has not updated for 20 minutes.
One vendor reports 1.1578 while another reports 1.1452.
An oil price falls by 40%, not because the market crashed, but because a decimal point was misplaced.
Should the bank continue using that price?
Should trading be suspended?
Which portfolios are affected?
Does someone need to investigate immediately?
A market-risk team must answer these questions quickly. Yet large financial institutions may receive thousands of control alerts during a single business day.
That creates a second risk: alert overload.
When every alert looks urgent, genuinely dangerous incidents can disappear into the noise.
Our goal is to build a cockpit that does more than detect technical exceptions. It should help analysts answer three practical questions:
- What happened?
- How much could it matter?
- What should we investigate first?
Why Traditional Monitoring Is Not Enough
Banks rely heavily on deterministic controls.
A deterministic control follows an explicit rule:
If this condition occurs, create an alert.
Examples include:
- A price has not changed for 30 minutes.
- Feed latency exceeds five minutes.
- Two vendors differ by more than 2%.
- A daily movement exceeds its historical range.
- A required value is missing.
- An instrument updated outside its expected trading session.
These rules are essential because they are transparent, testable, and auditable.
An analyst can explain exactly why an alert fired.
But rules also have limitations.
A threshold that works during a quiet market may create hundreds of false positives during a central-bank announcement. A small pricing difference may be harmless for one portfolio but material for another. A large move may be genuine when all vendors and related instruments move together.
Traditional monitoring tells us that a condition was breached.
It does not always tell us whether the breach is:
- A genuine market event
- A vendor problem
- An internal processing failure
- A market holiday
- A timing difference
- A low-impact exception
- A major financial risk
This is where AI becomes useful.
Not as a replacement for established controls.
As an additional reasoning and prioritisation layer.
A More Accurate Way to Think About VaR
Before we design the cockpit, we need to clarify an important term.
Value at Risk, commonly called VaR, estimates a potential portfolio loss over a defined time horizon and confidence level under a chosen statistical model.
For example:
A one-day 99% VaR of USD 10 million means the model estimates that losses should exceed USD 10 million on roughly 1% of trading days, subject to the model’s assumptions.
VaR is not normally calculated by multiplying total exposure by an arbitrary percentage movement.
However, that multiplication is useful for a simpler calculation called scenario P&L or stress impact.
For a basic FX exposure:
Approximate scenario impact = FX exposure × assumed exchange-rate movementSuppose a portfolio has USD 60 million of relevant exposure and we apply a 1% adverse FX shock:
Estimated impact = USD 60,000,000 × 1% = USD 600,000The exact calculation depends on the currency direction, valuation conventions, hedges, sensitivities, nonlinear instruments, and portfolio aggregation.
In this project, we use simplified scenario impacts to demonstrate prioritisation. A production bank would connect the cockpit to its approved valuation, VaR, Expected Shortfall, stress-testing, and sensitivity engines.
Modern Basel market-risk standards also place substantial emphasis on Expected Shortfall for internal-model capital calculations because it captures tail losses differently from traditional VaR.
The Example We’ll Investigate
Suppose the cockpit receives the following EUR/USD prices:
| Source | Price |
| Reuters | 1.1502 |
| Bloomberg | 1.1503 |
| Internal feed | 1.1350 |
Something looks suspicious.
But the price difference alone is not enough to determine the cause.
Now add more context:
- Reuters and Bloomberg closely agree.
- Other major currency pairs remain stable.
- The market is open.
- The internal feed has not updated for 15 minutes.
- The affected portfolio has USD 60 million of exposure.
- Similar historical incidents were caused by internal feed delays.
The likely explanation becomes clearer:
This is probably an isolated internal-data problem rather than a market-wide FX movement.
The alert also deserves attention because it affects a material portfolio.
This is the type of reasoning our cockpit will automate.
Understanding the Market-Data Controls
Stale Price
A stale price is an observation that has not changed or refreshed when updates would normally be expected.
For example:
10:00 — EUR/USD = 1.1501
10:05 — EUR/USD = 1.1501
10:10 — EUR/USD = 1.1501
10:20 — EUR/USD = 1.1501
A repeated value is not automatically wrong.
The market may be closed, the instrument may be illiquid, or the price may genuinely remain unchanged.
A stronger stale-price control combines several signals:
- Time since the last update
- Number of repeated observations
- Market session
- Movement in peer instruments
- Update frequency expected for that instrument
- Vendor-specific publishing behaviour
Vendor Divergence
Banks often compare more than one market-data source.
Suppose:
Bloomberg EUR/USD = 1.1502
Reuters EUR/USD   = 1.1504
Internal EUR/USD  = 1.1320
The internal value is far from the two external sources.
That does not prove the internal price is wrong, but it creates a strong reason to investigate it.
Vendor-divergence thresholds should consider:
- Instrument liquidity
- Bid, ask, or mid-price conventions
- Timestamp alignment
- Market volatility
- Trading venue
- Quote currency
- Vendor methodology
Feed Latency
A price may be numerically correct but arrive too late.
For some use cases, a delay of several minutes may be acceptable. For electronic trading, even seconds can matter.
A basic latency feature is:
Feed latency = Processing timestamp − Source timestamp
The threshold should depend on the instrument, system, business process, and service-level agreement.
Extreme Movement
A large price movement is not necessarily bad data.
Markets can move sharply after:
- Interest-rate announcements
- Elections
- Geopolitical events
- Currency intervention
- Earnings releases
- Commodity supply shocks
- Unexpected economic data
A large move becomes more suspicious when:
- Only one vendor reports it
- Related instruments do not react
- No relevant event explains it
- The observation immediately reverses
- The price lies far outside the recent distribution
Business Impact
Not every data problem deserves the same priority.
A questionable price affecting a USD 50,000 position is different from one affecting a USD 500 million portfolio.
Business impact can consider:
- Gross and net exposure
- Estimated P&L impact
- VaR or Expected Shortfall contribution
- Stress-loss contribution
- Number of portfolios affected
- Regulatory-reporting impact
- Client-pricing impact
- Trading activity
- Data criticality
The cockpit should therefore prioritise alerts using both technical severity and financial materiality.
Market Scenario
A market scenario describes the wider environment around an observation.
Examples include:
- Central-bank rate decision
- FX intervention
- Equity-market crash
- Oil-supply shock
- Sovereign downgrade
- Market holiday
- Exchange outage
- Unexpected inflation announcement
Context helps distinguish a genuine market movement from a broken feed.
Solution Architecture
Our cockpit uses a layered architecture.
Each layer has one clear responsibility.
Market-data vendors and internal feeds
                    ↓
          Data ingestion and alignment
                    ↓
          Data-quality validation
                    ↓
              Feature engineering
                    ↓
       Deterministic control engine
                    ↓
      Machine-learning anomaly detection
                    ↓
    Market context and historical evidence
                    ↓
 Portfolio exposure and scenario-impact engine
                    ↓
       Alert scoring and prioritisation
                    ↓
      Generative AI investigation report
                    ↓
      Streamlit Market Risk Cockpit (Optional)
                    ↓
             Human analyst action
The most important design principle is that the language model does not directly decide whether a price is valid.
Deterministic code and statistical models generate the evidence.
The LLM translates that evidence into a readable investigation summary.
This separation makes the solution easier to test, govern, and audit.
Project Structure
A modular project might use the following structure:
market-risk-cockpit/
│
├── app.py
├── requirements.txt
├── README.md
│
├── config/
│   ├── rules.yaml
│   └── scenarios.yaml
│
├── data/
│   ├── market_observations.csv
│   ├── portfolio_exposures.csv
│   ├── historical_alerts.csv
│   └── market_scenarios.csv
│
├── src/
│   ├── data_generation.py
│   ├── data_quality.py
│   ├── feature_engineering.py
│   ├── rule_engine.py
│   ├── anomaly_model.py
│   ├── context_engine.py
│   ├── impact_engine.py
│   ├── prioritisation.py
│   └── report_generator.py
│
└── outputs/
    ├── enriched_market_data.csv
    ├── prioritised_alerts.csv
    └── investigation_reports/
This modular design lets us replace one component without rewriting the entire system.
For example, we could:
- Replace synthetic data with live Kafka events
- Move rules from Python into a configuration service
- Replace Isolation Forest with another anomaly model
- Connect a bank-approved LLM
- Replace CSV storage with a governed data platform
- Add a case-management workflow
Build the Project
Step 1 — Create the Market-Risk Datasets
Why this step exists
A control platform needs more than a stream of prices.
To decide whether an observation matters, it also needs exposure, market scenarios, and historical evidence.
For this demonstration, we generate four synthetic datasets.
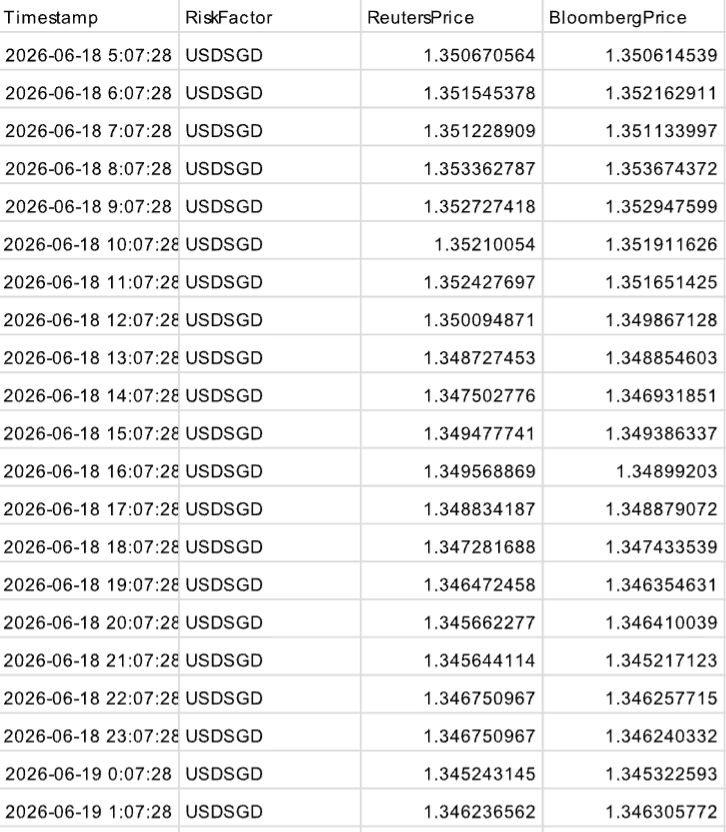
Dataset 1: Market Observations
The market-observation dataset contains prices from vendors such as Bloomberg and Reuters, along with an internal feed.
Example instruments include:
- USD/SGD
- EUR/USD
- GBP/USD
- USD/JPY
The synthetic generator should mostly produce normal observations while deliberately injecting a small number of problems:
- Repeated prices
- Missing values
- Delayed timestamps
- Vendor disagreements
- Large isolated jumps
This gives us known test cases for the control pipeline.
Dataset 2: Market Scenarios
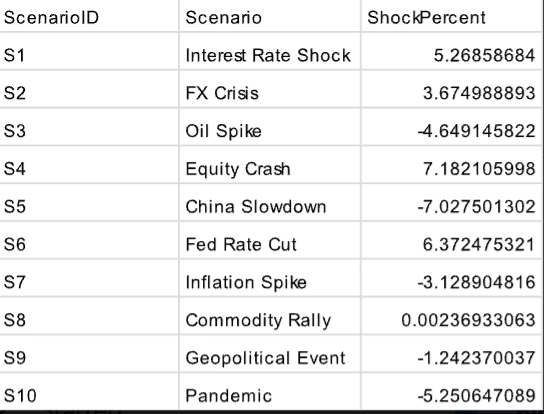
The scenario table contains hypothetical market shocks.
Examples include:
- Interest-rate shock
- FX crisis
- Oil-price spike
- Equity crash
- Flight to quality
- Regional currency devaluation
These scenarios are not a replacement for a bank’s official stress-testing methodology. They provide a transparent demonstration of how market-data alerts can be connected to potential portfolio impact.
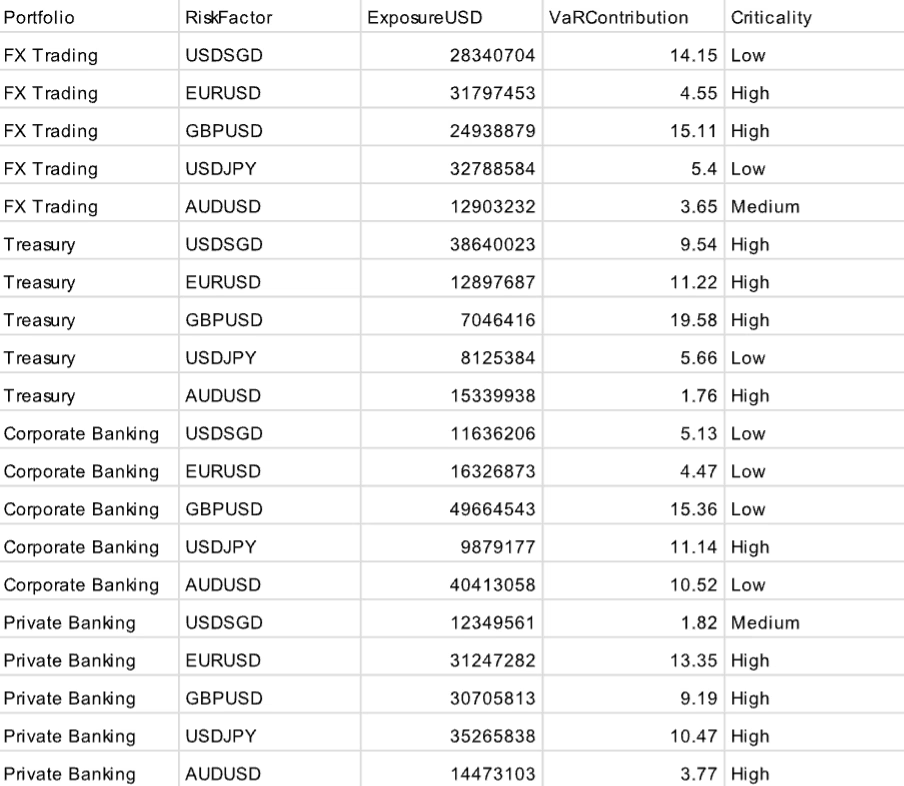
Dataset 3: Portfolio Exposures
We create several illustrative portfolios:
- FX Trading
- Treasury
- Corporate Banking
- Private Banking
Each portfolio has exposure to one or more currencies.
This table allows us to translate a technical data-quality problem into a business question:
How much financial exposure depends on this observation?
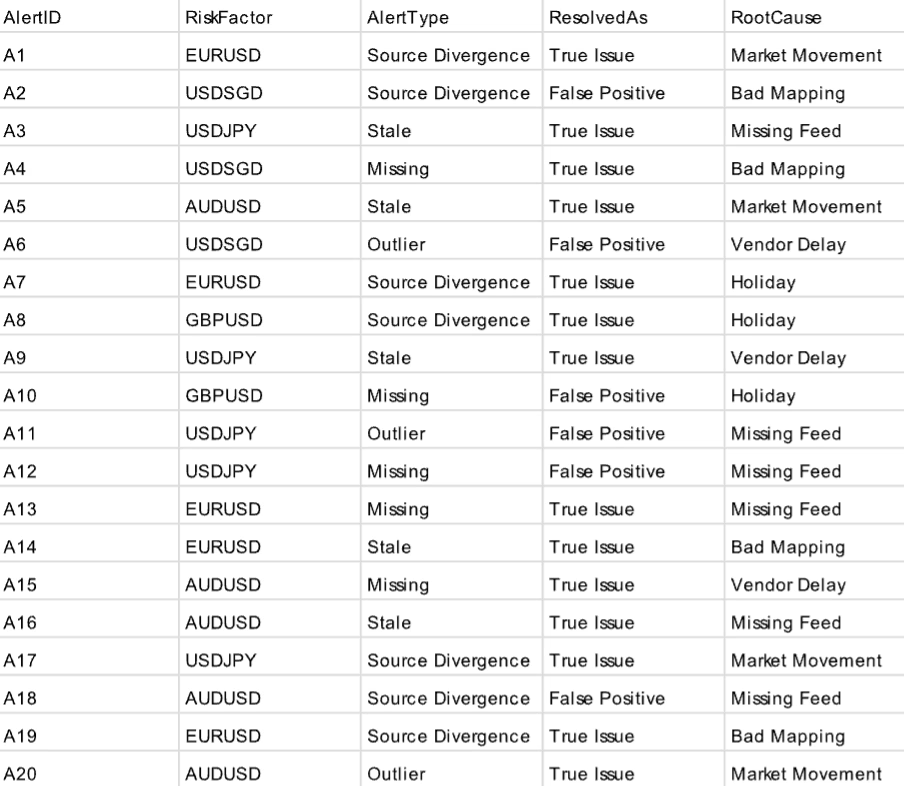
Dataset 4: Historical Alerts
The final dataset contains previous control incidents.
Historical incidents can help us identify recurring patterns.
For example:
- Internal feed delayed during batch processing
- Vendor timestamp interpreted in the wrong timezone
- Illiquid instrument incorrectly marked as stale
- Price spike caused by a market event
- Holiday calendar missing for one region
In a real implementation, these datasets would come from governed sources such as market-data platforms, risk engines, position stores, reference-data systems, and incident-management tools.
Step 2 — Validate the Data and Engineer Features
Why this step exists
A model cannot rescue fundamentally broken input data.
Before running anomaly detection, we validate the basic integrity of the datasets.
Typical checks include:
- Required columns are present
- Timestamps can be parsed
- Instrument identifiers are valid
- Prices are numeric and positive where appropriate
- Source names are recognised
- Duplicate records are handled
- Currency conventions are consistent
- Exposure values use the expected units
- Missing values are explicitly flagged
After that, we create features.
A feature is a useful signal derived from raw data.
| Feature | Purpose |
| Price change | Detect sudden movement |
| Percentage return | Compare movements across instruments |
| Rolling mean | Estimate the recent expected level |
| Rolling standard deviation | Measure recent volatility |
| Z-score | Measure distance from recent behaviour |
| Vendor difference | Detect disagreement among sources |
| Feed latency | Identify delayed observations |
| Repeated-value count | Support stale-price detection |
| Market session | Add trading-hours context |
| Portfolio exposure | Estimate business materiality |
Understanding Rolling Statistics
A rolling mean summarises the recent average price.
Imagine looking through a moving window that contains the latest 20 observations.
Every time a new price arrives:
- The oldest observation leaves the window.
- The newest observation enters.
- The mean and standard deviation are recalculated.
This gives the system a changing view of normal behaviour.
Understanding the Z-Score
A z-score describes how unusual an observation is relative to its recent history.
You can think of it as a distance meter.
- A value near zero is close to the recent average.
- A large positive value is unusually high.
- A large negative value is unusually low.
A z-score alone does not prove that a price is wrong. During a genuine market shock, many correct prices may have large z-scores.
That is why we combine it with vendor agreement, market context, and exposure.
The enriched dataset is saved for the next stages.
Step 3 — Apply Deterministic Rules
Why this step exists
Rules are the cockpit’s first line of defence.
They are easy to test, explain, document, and audit.
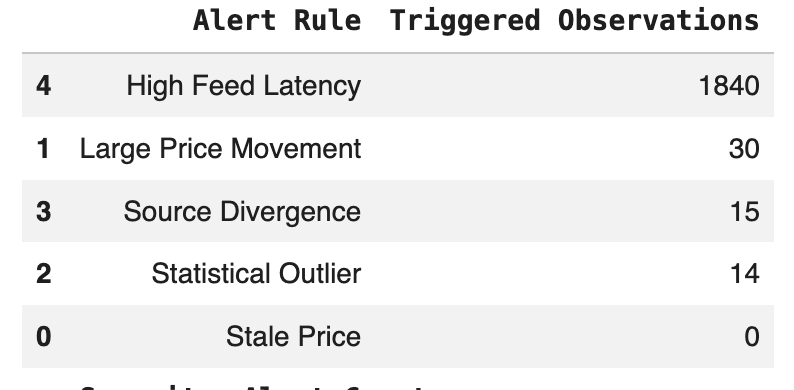
The rule engine checks for conditions such as:
- Stale prices
- Vendor disagreement
- Excessive feed latency
- Extreme movement
- Missing prices
- Invalid timestamps
- Unexpected market-session activity
A simplified stale-price condition might look like:
relative_change = abs(current_price - previous_price) / previous_price

is_stale = (
    relative_change < stale_tolerance
    and minutes_since_update > stale_time_limit
    and market_is_open
)
Notice that we do not declare a price stale merely because its value stayed unchanged.
We also check how long it has remained unchanged and whether the market is expected to be active.
Combining Multiple Rules
A single rule should not always determine severity.
Instead, we combine several rule outputs.
Assume each rule produces either 0 or 1:
Stale-price flag          × 25
Vendor-divergence flag    × 25
High-latency flag         × 15
Extreme-movement flag     × 25
Missing-value flag        × 10
The maximum score is 100:
Rule severity score
= 25 × stale
+ 25 × divergence
+ 15 × latency
+ 25 × extreme movement
+ 10 × missing value
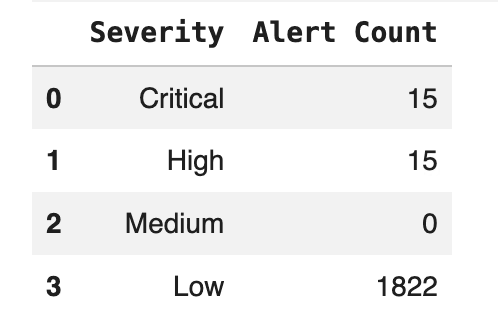
We can then map the score to a category:
| Score | Rule severity |
| 70–100 | Critical |
| 45–69 | High |
| 20–44 | Medium |
| 1–19 | Low |
| 0 | No rule alert |
These weights are illustrative.
In production, they should be calibrated using historical incidents, risk appetite, control-owner judgement, and model-validation evidence.
Step 4 — Detect Statistical Anomalies with Isolation Forest
Why this step exists
Rules only detect behaviours that someone predicted in advance.
Machine learning can help find unusual combinations that were not explicitly encoded.
Instead of asking:
Did a threshold get breached?
The model asks:
Does this observation look unusual compared with historical behaviour?
For this project, we use Isolation Forest, an unsupervised anomaly-detection algorithm available in Scikit-learn.
The algorithm isolates observations using repeated random splits. Unusual observations tend to be separated with fewer splits than common observations.
Understanding Isolation Forest
Imagine placing all normal market observations in a crowded city.
Most observations live close to many neighbours.
An anomaly lives alone, far outside the busy centre.
If you repeatedly divide the city into smaller areas, the isolated observation becomes separated very quickly.
That is the intuition behind Isolation Forest.
It does not need labelled examples of every possible failure.
It learns the structure of the data and identifies observations that are easier to isolate.
Selecting Model Features
Useful inputs might include:
price_change
rolling_volatility
z_score
vendor_difference
feed_latency_seconds
Avoid feeding raw identifiers such as portfolio names or vendor labels into the model without appropriate encoding and a clear reason.
The model produces:
- An anomaly label
- An anomaly score
- A relative measure of how unusual the observation appears
We transform that output into a consistent 0–100 AI severity score for downstream prioritisation.
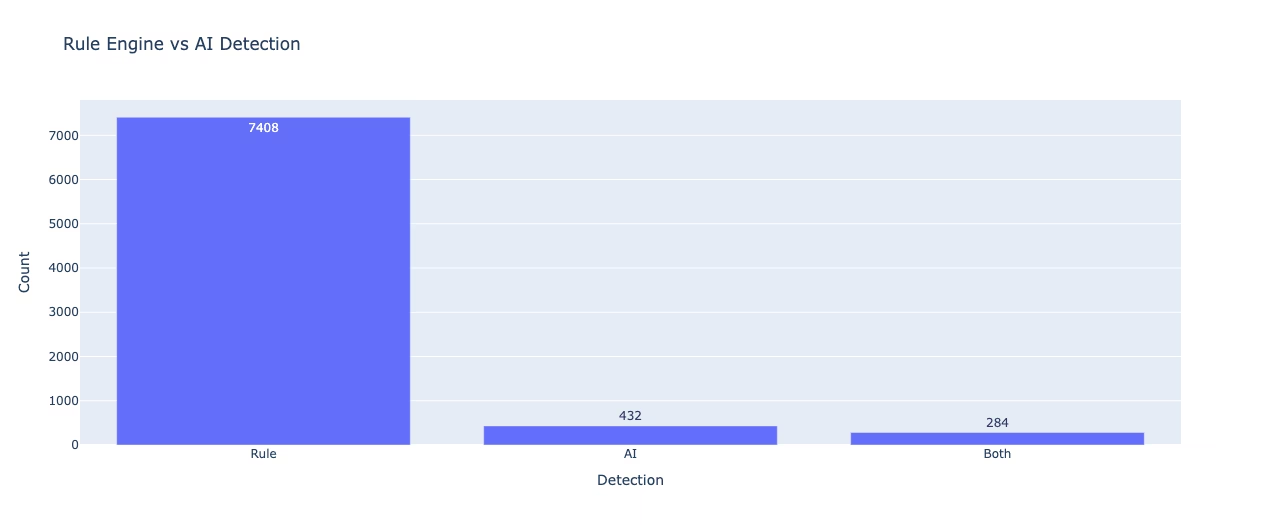
Rule Engine vs AI Detection
| Rule engine | Isolation Forest |
| Uses predefined thresholds | Learns patterns from data |
| Highly explainable | Requires additional explanation |
| Detects known failure modes | May find unexpected combinations |
| Easy to audit | Requires model governance |
| Can be brittle during regime changes | Can drift as market behaviour changes |
The strongest architecture uses both.
Rules provide control certainty.
Machine learning provides pattern discovery.
Step 5 — Add Market Context and Explainability
Why this step exists
An anomaly score does not explain what happened.
Analysts need evidence.
For each alert, the context engine should answer:
- Is the movement isolated or market-wide?
- Do other vendors agree?
- Are peer instruments moving?
- Is the affected market open?
- Did a relevant market event occur?
- Has a similar incident happened before?
- Which root cause is most plausible?
Peer-Instrument Comparison
Suppose EUR/USD moves sharply.
We might also inspect:
- GBP/USD
- USD/CHF
- EUR/GBP
- A broad US-dollar index
- Relevant interest-rate expectations
If several related instruments move consistently, the event may be genuine.
If only one source for one instrument moves, a data problem becomes more likely.
Historical Similarity
The system can compare the current alert with previous incidents using structured features such as:
- Instrument
- Source
- Alert type
- Latency
- Vendor difference
- Market session
- Direction and size of movement
A more advanced version could convert incident descriptions into embeddings and retrieve semantically similar cases from a vector database.
Embeddings are numerical representations of meaning.
Think of them as coordinates on a map: incidents with similar meaning appear near one another even when they use different words.
Confidence Score
The context layer can calculate a confidence score based on evidence.
For example:
Vendor agreement evidence        25%
Peer-instrument evidence         20%
Market-session evidence          10%
Historical similarity            15%
Rule consistency                 15%
Model confidence                 15%
A resulting action policy might be:
| Confidence | Suggested action |
| Above 80 | Escalate immediately |
| 60–80 | Investigate |
| 40–59 | Monitor and gather evidence |
| Below 40 | Low-confidence alert |
A confidence score should be interpreted as a decision-support signal—not as a guaranteed probability that the price is wrong.
Step 6 — Estimate Financial Impact
Why this step exists
A technically severe alert may have little financial impact.
A subtle anomaly may affect a major portfolio.
The impact engine connects each alert to exposure and scenario information.
For a simplified linear FX position, we calculate:
Shocked price = Current price × (1 + scenario shock)
Then:
Estimated scenario P&L ≈ Relevant exposure × scenario movement
For real portfolios, the calculation may require:
- Delta and other sensitivities
- Full revaluation
- Currency conversion
- Netting and hedging
- Options and nonlinear payoffs
- Liquidity horizons
- Cross-risk aggregation
- Approved market-risk methodologies
The cockpit should ideally consume results from official risk engines rather than reproduce those calculations independently.
Step 7 — Prioritise Alerts by Business Risk
Why this step exists
Analysts do not need another list of 500 alerts.
They need to know which five alerts could matter most.
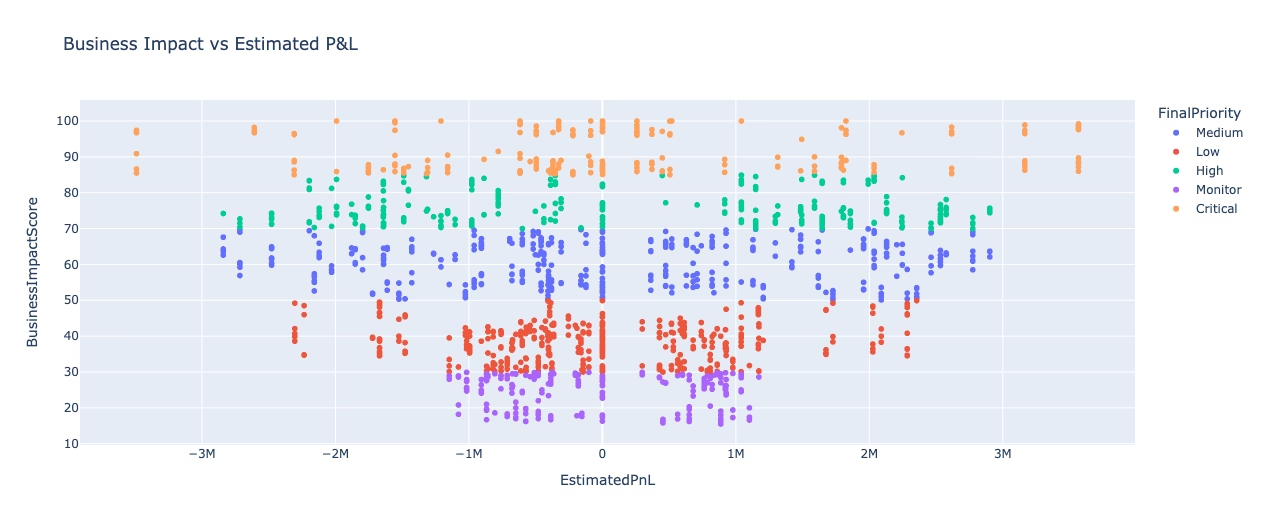
To create a business-impact score, we first convert every component to a common 0–100 scale:
- Rule severity
- AI anomaly severity
- Context confidence
- Exposure materiality
- Estimated scenario-loss materiality
Then we calculate a weighted average:
Business impact score
= 0.25 × rule severity
+ 0.20 × AI severity
+ 0.20 × confidence
+ 0.20 × exposure materiality
+ 0.15 × scenario-loss materiality
Because the weights sum to 1, the final score remains between 0 and 100.
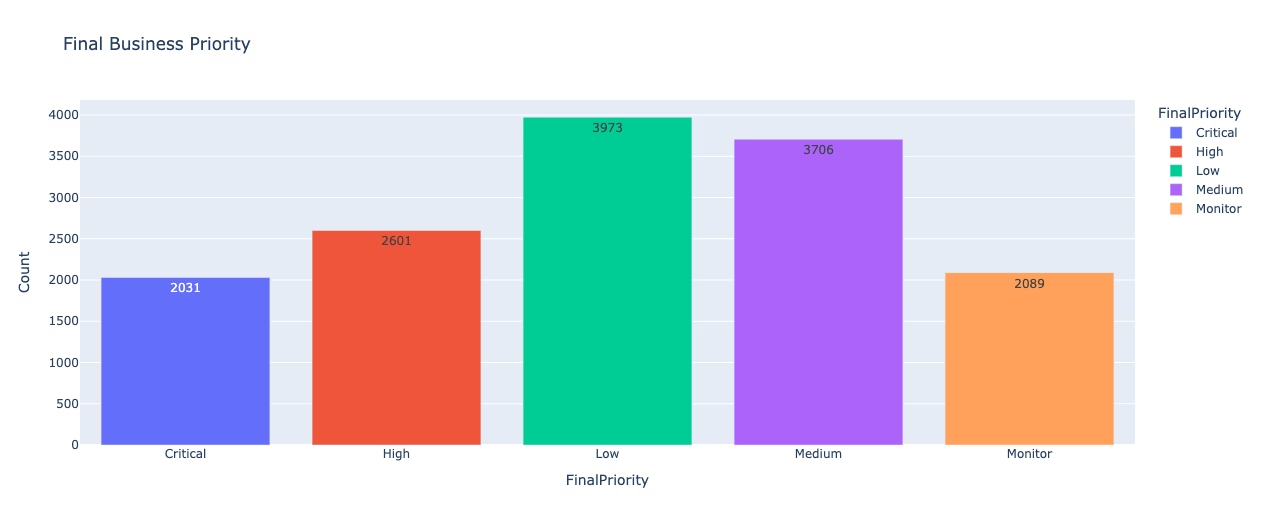
We map it to a priority:
| Score | Final priority |
| 85–100 | Critical |
| 70–84 | High |
| 45–69 | Medium |
| 1–44 | Low |
This design is more reliable than adding a raw exposure amount directly to a score.
USD 500 million and a severity score of 80 use completely different units. Exposure must first be normalised using agreed materiality bands or a bounded transformation.
Step 8 — Generate an AI Investigation Report
Why this step exists
By this point, the system has assembled a large amount of evidence:
- Triggered rules
- Model score
- Vendor comparison
- Peer movement
- Feed latency
- Market session
- Historical incidents
- Portfolio exposure
- Estimated impact
- Recommended priority
An analyst should not need to read ten tables to understand one incident.
A large language model can convert the structured evidence into a concise investigation report.
Keep the LLM Inside Guardrails
The model should not:
- Invent missing prices
- Calculate official regulatory capital
- Approve a replacement data source
- Execute trades
- close incidents without human review
- Hide uncertainty
- Override deterministic controls
- expose confidential data to an unapproved service
# SAMPLE LLM REPORT #

## Executive Assessment

A high-priority alert flagged unusually high feed latency for AUDUSD (322 seconds), coinciding with an estimated negative P&L impact of ~‑1.9m and portfolio exposure ~40.4m. Vendor agreement is strong and the issue is not market-wide, so this appears to be delayed/latent market data rather than a genuine market move. Urgent investigation is required because 5+ minute stale prices can produce incorrect valuations, misstate P&L and VaR, and cause unsafe trading decisions. Immediate action should be taken within the hour to contain risk.

## Likely Root Cause

Most likely cause: delayed market data feed / infrastructure latency (rule: High Feed Latency; evidence: 322s feed delay). Supporting evidence: strong vendor agreement and non-market-wide flag — prices are consistent across sources but late. Contradiction: historical_root_cause = "Market Movement" — however current signals favor a data-delivery issue. Confidence: Moderate.

## Business Impact Assessment

- Valuation: marks may be stale leading to incorrect mark-to-market valuations across affected positions.
- P&L: estimated adverse impact ~‑1.9m; realised P&L could change after repricing.
- VaR: reported VaR (~198k) may be misestimated while using delayed inputs.
- Trading decisions: execution and risk limits may be breached if desks trade on stale prices.
- Regulatory reporting: end-of-day marks and reports could be inaccurate if unresolved.
- Operational risk: increased — potential for incorrect hedging, client disputes and remediation.

## Recommended Actions

Immediate (highest priority)
1) Confirm feed health and timestamps; failover to alternate vendor or historical snapshot within 1 hour and switch pricing source if latency persists.
2) Alert trading desks and restrict new AUDUSD execution or require manual price confirmation until resolved.
3) Reprice affected positions once fresh data available, quantify realised vs estimated P&L/VaR corrections, and hold adjustments for audit.

Follow-up
4) RCA with Market Data/Infra and vendor; log incident and tighten latency thresholds.

## Overall Assessment

Priority: High
AI Confidence: Moderate
Final Recommendation: Failover to an alternate market-data source immediately, pause automated AUDUSD trading until fresh ticks are confirmed and repricing completed.

===========================================================================
What AI Adds—and What It Does Not
AI adds the most value in three areas.
Pattern Detection
Machine learning can identify unusual combinations of latency, price movement, volatility, and vendor disagreement.
Prioritisation
Exposure and scenario impact help move the most material alerts to the top of the queue.
Communication
Generative AI can transform structured evidence into a readable investigation summary.
But AI does not eliminate the need for:
- Data ownership
- Deterministic controls
- Approved valuation models
- Human judgement
- Audit trails
- Model validation
- Access controls
- Incident governance
- Regulatory compliance
The objective is not autonomous market-risk management.
The objective is faster, better-informed human decision-making.
Try It Yourself
Beginner Exercises
- Add USD/JPY and AUD/USD to the synthetic dataset.
- Change the stale-price threshold and observe alert volumes.
- Add a dashboard filter for vendor and instrument.
- Plot alert counts by severity.
- Inject a missing price and confirm that the rule fires.
Intermediate Exercises
- Use different thresholds for liquid and illiquid instruments.
- Add market-session calendars.
- Compare Isolation Forest with Local Outlier Factor.
- Calculate false-positive rates using historical outcomes.
- Add portfolio-specific materiality thresholds.
- Retrieve similar historical incidents using embeddings.
Advanced Exercises
- Replace batch CSV files with streaming events.
- Add model-drift monitoring.
- Connect the cockpit to an approved risk engine.
- Use full revaluation for options and derivatives.
- Introduce maker-checker approval for data overrides.
- Add role-based access control and immutable audit logs.
- Evaluate LLM reports against analyst-written reports.
- Create separate models for different market regimes.
- Monitor cross-asset relationships.
- Add a case-management integration for incident escalation.
Real-World Applications
Foreign Exchange
Detect stale spot rates, conflicting forward points, delayed feeds, and unusual cross-currency relationships.
Fixed Income
Monitor government-bond yields, credit spreads, curve inversions, missing tenors, and inconsistent discount curves.
Equities
Detect price spikes, stale closing prices, corporate-action issues, and exchange-specific discrepancies.
Commodities
Identify suspicious oil, gas, metals, and agricultural prices across venues and delivery dates.
Derivatives
Monitor implied volatility, option surfaces, correlation inputs, and inconsistent marks.
Risk Reporting
Prioritise anomalies affecting:
- VaR
- Expected Shortfall
- Stress testing
- P&L explain
- Limit monitoring
- Regulatory reporting
Valuation Control
Identify observations that could affect independent price verification, valuation adjustments, and fair-value reporting.
Limitations and Ethical Considerations
What This Project Can Do
This project can:
- Demonstrate a modular market-data control architecture
- Detect several common data-quality issues
- Identify statistical anomalies
- Connect alerts with illustrative exposure
- Rank alerts using transparent scores
- Generate draft investigation reports
- Provide an interactive analyst workflow
What It Cannot Do
This demonstration cannot:
- Calculate production-grade regulatory VaR
- Guarantee that an anomaly is erroneous
- Replace approved pricing and risk engines
- Resolve every market-data incident
- Safely operate without human review
- Provide trading advice
- Replace model validation or risk governance
Model Risk
Isolation Forest may produce unstable results when:
- Market regimes change
- Training data is unrepresentative
- Features are poorly scaled
- The assumed anomaly rate is wrong
- Different instrument types are mixed carelessly
Generative-AI Risk
An LLM may produce plausible but unsupported statements.
Every generated claim should be grounded in supplied evidence. Important numbers should be calculated by deterministic code, not by the language model.
Data Privacy
Market positions, exposures, client information, and internal incidents may be confidential.
A financial institution should use only approved infrastructure, apply data minimisation, redact sensitive fields where appropriate, and retain complete audit logs.
Human Accountability
The cockpit supports analysts.
It should not silently replace accountable decision-makers.
High-impact actions such as price overrides, trading restrictions, valuation adjustments, or regulatory submissions require approved human-controlled workflows.
Key Takeaways
Market-data risk is not simply a data-cleaning problem.
It is a decision-prioritisation problem.
A useful control cockpit combines four types of intelligence:
- Rules identify known failure conditions.
- Machine learning discovers unusual patterns.
- Risk and exposure data reveal business materiality.
- Generative AI converts evidence into an investigation narrative.
The architecture works because each component has a limited, well-defined role.
Rules remain transparent.
Models provide an additional signal.
Financial calculations remain deterministic.
The LLM explains rather than decides.
The analyst remains accountable.
That is what responsible AI in financial risk should look like.
Where to Go Next
This project deliberately focuses on FX market data.
The next version can expand the same framework to:
- Interest-rate curves
- Government-bond yields
- Credit spreads
- Equity prices
- Commodity curves
- Option volatility surfaces
- Market reference data
- Expected Shortfall
- Stress-testing results
- P&L explain
- Regulatory-risk reporting
The next project will extend the cockpit into a real-time, event-driven architecture using streaming market data, a vector database for historical incidents, and governed AI agents for investigation support.
Want to learn more about everyday use of AI?
Discover more from Debabrata Pruseth
Subscribe to get the latest posts sent to your email.