
A Beginner’s Guide to Time Series Modeling
- A Beginner’s Guide to Time Series Modeling
- 1. What Is Time Series Forecasting (and Why It Matters)
- 2. Types of Time Series Problems
- 3. Core Techniques for Solving Time Series Problems
- 4. Traditional and Machine Learning Techniques for Time Series
- 5. Deep Learning and Pre-Trained Time Series Models
- 6. Using Large Language Models (LLMs) for Time Series
- 7. Global Models for Time Series
- 8. Preparing and Transforming Datasets for Time Series Models
- 9. Anomaly Detection in Time Series
- Final Summary: What You’ve Learned About Time Series
1. What Is Time Series Forecasting (and Why It Matters)
Every day, we make little predictions without realizing it — checking the sky to decide whether to carry an umbrella, glancing at the traffic to guess how long the drive will take, or estimating how fast our phone battery will drain.
In data science, that same instinct has a name: time series forecasting.
At its core, time series forecasting means using past observations to predict what’s likely to happen next. It looks for patterns, trends, and rhythms hidden inside time-ordered data — from daily temperatures to hourly stock prices — and then uses those patterns to make informed guesses about the future.
What makes time series data special is its memory.
In ordinary machine-learning problems, each data point stands alone. But in a time series, today’s value depends on yesterday’s — and often on the day before that too. This built-in dependency is what makes forecasting both fascinating and challenging.
Real-World Use Cases Across Industries
Retail & Supply Chain
Stores and warehouses use forecasting to predict product demand. Better forecasts mean the right number of toys on shelves before the holidays — not too many, not too few. It’s how companies like Amazon or Walmart fine-tune inventory, shipping, and staffing.
Finance
Traders and analysts rely on time series models to anticipate stock prices, interest rates, and market trends. Even small improvements in accuracy can shape investment strategies or algorithmic-trading decisions.
Energy
Power companies forecast electricity demand so they can generate just enough energy to meet it — saving fuel, preventing blackouts, and keeping the grid balanced.
Weather & Climate
Meteorologists study decades of atmospheric data to predict rainfall, storms, or heatwaves. Long-range climate forecasts also guide agriculture, urban planning, and disaster-preparedness policies.
Whether it’s predicting a heatwave or next month’s sneaker sales, time series forecasting quietly powers much of the modern world.
What Kind of Data Can Be Forecasted?
If it changes over time, it can be forecasted. Formally, a time series is a sequence of ordered pairs (T, V) — where T represents time, and V is the observed value at that moment. Here are some common examples:
- Continuous variables: hourly electricity usage, stock prices, heart-rate readings, annual rainfall
- Discrete variables: daily customer counts, monthly sales, number of website logins
- Event-based sequences: machine-sensor alerts, social-media posts, or system logs
In short: if you can record it over time, you can turn it into a time series — and if you can find its pattern, you can forecast its future.
2. Types of Time Series Problems
Some time series rise and fall with the seasons, like ice-cream sales in summer. Others follow slower trends — the steady growth of internet users, for instance. Recognizing these patterns is the first step to choosing the right kind of problem to solve.
Univariate vs. Multivariate Time Series
Univariate Time Series
A univariate time series tracks just one variable over time.
Think:
- the daily temperature in Singapore,
- the number of passengers boarding flights each month,
- or your heart-rate reading from a fitness watch.
Each moment gives you one value — simple but powerful.
Multivariate Time Series
A multivariate series records two or more variables that move together.
Imagine a smartwatch capturing acceleration on three axes (x, y, z), or a stock-market file tracking price, volume, and volatility side by side.
Each timestamp now holds a vector of values, showing how several factors interact through time.
Knowing whether your data is univariate or multivariate shapes everything that follows — from which model you choose to how you prepare the data.
Common Types of Time Series Problems
Time series tasks fall into a few broad families, each answering a slightly different question:
- Forecasting — “What comes next?”
Use past behavior to predict future values
Example: forecasting tomorrow’s temperature or next week’s store sales.
- Classification — “What kind of pattern is this?”
Assign labels to an entire series or to its segments.
Example: labeling ECG signals as “healthy” or “abnormal,” or detecting whether a machine’s vibration pattern signals a fault.
- Anomaly Detection — “Is something odd happening?”
Spot moments that deviate from the usual rhythm.
Example: a sudden traffic dip on a website or a suspicious spike in credit-card spending.
- Segmentation / Change-Point Detection — “Where does behavior shift?”
Divide a sequence into meaningful sections.
Example: recognizing warm-up, peak, and cool-down phases in workout data.
- Similarity Search / Clustering — “Who behaves like whom?”
Group related patterns across multiple series.
Example: clustering customers with similar shopping habits or comparing production-line signals for quality control.
How to Choose the Right Approach
- Single series: start with forecasting, anomaly detection, or segmentation.
- Many related series: explore classification, clustering, or similarity search.
- Cross-domain data: consider global models that learn shared patterns across different sources (we’ll unpack these further in this blog).
3. Core Techniques for Solving Time Series Problems
When you’re working with time series data, your first question shouldn’t be “Which algorithm should I use?” — but rather, “What kind of story does my data tell?”
That story determines whether you’re studying a single sequence (like one patient’s heartbeat) or a collection of sequences (like hundreds of patients’ ECGs).
Once you know that, you can choose the right tool for the job.
Broadly, time series problems fall into two worlds:
- Collection of Time Series — when you have many labeled or unlabeled sequences
- Single Time Series — when you focus on one continuous stream of data
And in between, there are tasks that blend both.
A. Collection of Time Series
When you have multiple time series — each representing a separate entity such as a person, sensor, or store — your goal might be to classify, predict, or group them.
Let’s look at the key techniques.
1. Time Series Classification (TSC)

Goal: Teach a model to assign a label based on temporal behavior.
Each training sample is a full time series paired with a known class.
Examples:
- Predict whether an ECG trace shows a healthy or irregular heartbeat
- Detect whether smartwatch readings represent walking, running, or resting
Key Idea: The model learns to recognize patterns over time that separate one class from another.
Toolkit Reference: AEON Toolkit – Classification Example
2. Time Series Regression

Goal: Predict a continuous value instead of a discrete label. Regression helps answer “How much?” rather than “Which type?”
Examples:
- Estimate soil potassium concentration from spectrograms
- Predict annual crop yield using historical weather data
Toolkit Reference: AEON Toolkit – Regression Example
3. Time Series Clustering

Goal: Group similar time series together without labels — a classic unsupervised learning task. Clustering helps uncover hidden structures or natural groupings within large datasets.
Examples:
- Group stores with similar sales trends
- Cluster industrial sensor signals to find machines that behave alike
Toolkit Reference: AEON Toolkit – Clustering Example
The Role of Distance Functions
Before you can cluster or compare time series, you need to measure how similar they are.
Common distance measures include:
- Euclidean Distance: Simple, but assumes sequences are perfectly aligned.
- Dynamic Time Warping (DTW): Allows flexible alignment when sequences shift in time.
- Correlation-Based Distance: Captures similarity in pattern shape, even if magnitudes differ.
Choosing the right distance function can make or break your analysis.
B. Single Time Series
When you have just one continuous series — say, daily electricity usage or a heart-rate trace — the focus is on detecting, predicting, or segmenting behaviors within that stream.
4. Anomaly Detection

Goal: Spot points or regions that deviate from what’s “normal.”
Types:
- Unsupervised: Works without labels — flags outliers directly.
- Semi-supervised: Learns what “normal” looks like, then marks deviations.
- Supervised: Trained with known examples of anomalies.
Examples:
- Detect unusual heartbeats in ECG data
- Spot abnormal spikes in server CPU utilization
Reference: AEON Toolkit – Anomaly Detection Example
(We’ll explore anomaly detection in greater detail late)
5. Forecasting

Goal: Predict future values from past observations — the most common time series problem. Forecasting turns yesterday’s story into tomorrow’s insight.
Examples:
- Forecasting next week’s energy demand
- Predicting daily stock prices or web traffic
Popular Techniques:
- Classical: Exponential Smoothing, ARIMA
- Machine Learning: Random Forests, Gradient Boosting
- Deep Learning: RNNs, LSTMs, Temporal CNNs, Transformers
Reference: AEON Toolkit – Forecasting Example
6. Segmentation (Change Point Detection)

Goal: Split a series into meaningful chunks where behavior changes. Segmentation helps explain when and why systems change.
Examples:
- Detect transitions between walking, running, and sitting in fitness data
- Identify state shifts in machines (idle → active → failure)
Reference: AEON Toolkit – Segmentation Example
C. Both Single & Multiple Series
7. Similarity Search

Goal: Find time series (or subsequences) that resemble a given query pattern. Similarity search powers applications like pattern discovery, trend matching, and recommendation systems for temporal data.
Examples:
- Searching for repeating motifs in physiological data
- Finding similar vibration patterns across factory machines
Reference: AEON Toolkit – Similarity Search Example
4. Traditional and Machine Learning Techniques for Time Series
Before neural networks ruled the stage, time series forecasting had a long, elegant history built on mathematics and intuition. These classic models — from ARIMA to Random Forests — still form the backbone of many forecasting systems today. They’re simple, interpretable, and surprisingly effective when used right. Let’s explore how these traditional and machine-learning techniques laid the foundation for today’s deep-learning revolution.
4.1 Statistical Models for Time Series
Statistical models view time as a mathematical pattern — a mix of trend, seasonality, and random noise. They assume that what happens next depends on what happened before, in a predictable way.
Here are the most widely used ones:
Moving Average (MA)
- Predicts the next value by averaging a fixed number of past observations.
- Works best when data fluctuates around a stable mean.
- Example: Estimating tomorrow’s temperature using the average of the last 7 days.
Exponential Smoothing (ES)
- Gives more weight to recent data and less to older points.
- Ideal for capturing short-term shifts or trends.
- Variants include Simple Smoothing, Holt’s Linear Trend, and Holt-Winters Seasonal Model.
ARIMA (AutoRegressive Integrated Moving Average)
Often called the workhorse of classical forecasting, ARIMA blends three ideas:
- AR (AutoRegression): depends on past values.
- I (Integrated): removes trends to make data stable.
- MA (Moving Average): corrects errors from past forecasts.
Example: Forecasting monthly airline passengers or daily electricity demand.
Even today, a well-tuned ARIMA can compete with modern machine-learning models.
SARIMA (Seasonal ARIMA)
Extends ARIMA to handle repeating seasonal patterns — weekly, monthly, or yearly cycles.
Perfect for retail, tourism, or energy demand data that rises and falls with the seasons.
VAR (Vector AutoRegression)
When multiple variables affect each other — like temperature, humidity, and rainfall — VAR models their interactions.
Example: Understanding how weather factors together influence crop yield.
4.2 Machine Learning for Time Series
Statistical models shine with linear, predictable data. But when patterns become non-linear or influenced by many features, we turn to machine learning. Machine-learning models can discover relationships that humans might miss — especially when you include external signals such as weather, events, or promotions. Let’s look at some of the most common ones:
Decision Trees & Random Forests
- Split data into decision paths based on feature conditions.
- Handle non-linear relationships and multiple predictors.
- Work best when combined with lag features (past values used as inputs).
- Example: Forecasting tomorrow’s store sales using the past week’s sales, weather, and promotions.
Gradient Boosting (XGBoost, LightGBM, CatBoost)
- Builds an ensemble of shallow trees, each correcting the last.
- Handles missing data, categorical variables, and outliers gracefully.
- Widely used in Kaggle competitions for time-series forecasting due to accuracy and flexibility.
Support Vector Regression (SVR)
- Finds a smooth function that fits data within an acceptable error range.
- Great for smaller datasets with steady, continuous trends.
k-Nearest Neighbors (kNN)
- Looks for past situations similar to the present and predicts based on what happened next.
- Simple but effective when data volume is manageable.
- Example: Predicting next day’s demand by finding days with similar weather and promotions.
4.3 When to Use Statistical vs. Machine Learning Models
| Situation | Recommended Approach | Why |
| Small dataset, stable trend | ARIMA / Exponential Smoothing | Works well with limited data and interpretable |
| Clear seasonality | SARIMA / Prophet | Captures cyclical patterns |
| Many influencing variables | Random Forest / XGBoost | Can model interactions between predictors |
| Complex, non-linear behavior | Machine Learning | Learns hidden relationships |
| Long sequences and multiple series | Deep Learning (next chapter) | Handles large-scale, high-dimensional data |
Statistical models like ARIMA and Exponential Smoothing remain essential for interpretable, quick forecasting — great for learning the basics.
Machine-learning models such as Random Forests and XGBoost offer flexibility and handle complexity that pure statistics can’t.
Together, they form the bridge between traditional forecasting and the deep-learning era — showing how time-series analysis evolved from elegant equations to intelligent sequence learners.
Next, we’ll see how Deep Learning and Pre-Trained Time Series Models push forecasting even further — capturing patterns traditional models often miss.
5. Deep Learning and Pre-Trained Time Series Models
As time series data grew more complex — with many variables, non-linear trends, and long-term dependencies — traditional models like ARIMA began to struggle. That’s when deep learning stepped in, bringing the power to learn patterns directly from data rather than from human-designed rules.
Deep learning models can spot both short-term rhythms and long-term trends automatically, making them ideal for massive, dynamic datasets like weather, finance, and IoT sensors.
What Is Deep Learning for Time Series?
Think of deep learning as a digital brain made up of many layers of “neurons.” Each layer learns something slightly different — the first might notice simple wiggles and spikes, while deeper layers recognize trends, cycles, or anomalies.
For time series, these networks don’t just look at the current value; they learn how past events influence future outcomes. That’s how they capture long-range patterns that older models often miss.
5.1 Common Deep Learning Architectures for Time Series
Different neural architectures specialize in learning patterns over time. Here are some you’ll meet along your AI journey:
- FCN (Fully Convolutional Network) – Great for detecting local patterns and sudden changes.
- ResNet (Residual Network) – Uses shortcut connections to learn deep features efficiently.
- MLP (Multilayer Perceptron) – A simple feed-forward network that handles structured inputs.
- TimeCNN / MCDCNN – Convolution-based models built to process multi-channel temporal data.
- Encoder / InceptionTime / LITE-Time / CO-FCN – Advanced architectures designed to capture both global and local dependencies across time.
Each of these models handles time in a slightly different way, but they share one goal: to learn automatically from raw sequences without manual feature engineering.
You can explore more architectures in the Deep Learning for Time Series Classification Guide.
5.2 Pre-Trained Time Series Models
Training deep networks from scratch often requires huge datasets and expensive GPUs. To make life easier, researchers have created pre-trained models — neural networks that already know general time-based patterns.
You can then fine-tune these models on your own smaller dataset — a process called transfer learning. It’s like starting from a student who already understands the basics of rhythm and asking them to learn a new dance.
Let’s look at some popular options:
1. Facebook Prophet
Developed by Meta, Prophet is one of the easiest forecasting tools to use — perfect for business and web-traffic data.
It automatically breaks a time series into three components:
- Trend: long-term direction (growth or decline)
- Seasonality: repeating cycles (weekly, monthly, or yearly)
- Holidays/Events: one-off spikes or dips
Prophet also handles missing data, adjusts for outliers, and produces interpretable results — ideal for anyone forecasting sales, energy use, or social-media engagement.
2. Wavelet-Based Transformations (WBT)
Imagine zooming in and out of a photo: you see fine details when close, and overall shapes when far away.
Wavelets work the same way for time series. They break a signal into different scales, separating noise from meaningful patterns.
This helps deep models focus on both short-term spikes (like sudden traffic surges) and long-term drifts (like seasonal trends).
3. Temporal Fusion Transformer (TFT)
The Temporal Fusion Transformer is a deep learning model built for multi-step forecasting — predicting many time points into the future.
It automatically learns:
- Which features matter most (e.g., temperature, time of day, promotions)
- How these features interact with the target variable
The result? A model that can adapt to complex, multi-variable time series — from electricity load to retail sales — while remaining explainable and flexible.
4. N-BEATS (Neural Basis Expansion Analysis for Time Series)
N-BEATS is a neural architecture made for univariate forecasting — one variable at a time.
It uses a clever “back-and-forth” structure that captures both past and future dependencies, achieving high accuracy without heavy tuning.
What makes N-BEATS special is its generality: it works across many datasets — from finance to energy — often outperforming traditional models with minimal setup.
Why Pre-Trained Models Matter
Pre-trained models save time, energy, and resources. Instead of reinventing the wheel, you stand on the shoulders of models trained on millions of time points.
This approach is the future of time series forecasting — where general models can be adapted for any domain, just as pre-trained vision models like ResNet or language models like GPT revolutionized their fields.
6. Using Large Language Models (LLMs) for Time Series
In just a year, Large Language Models (LLMs) like ChatGPT, Gemini, and Claude have moved beyond text.
Researchers are now exploring how these models — once used mainly for writing and coding — could also understand and forecast time series data.
But before we get carried away, it’s important to separate what LLMs can truly do from what they only appear to do.
6.1 Can ChatGPT Really Do Time Series Forecasting?
Not exactly. Traditional LLMs like ChatGPT are trained on text, not numerical sequences.
When you ask them to “forecast next month’s sales,” they don’t crunch the numbers directly the way ARIMA or XGBoost would.
Here’s what really happens behind the scenes:
- The LLM converts numbers into tokens (word-like units it can process).
- It may then call pre-existing algorithms — such as ARIMA or Prophet — through code execution tools to perform the actual computation.
So while it feels like ChatGPT is “doing forecasting,” it’s really acting as a smart interface that explains, writes code, and interprets results — not as a dedicated forecasting engine.
In short:
LLMs are excellent assistants for time series — they can explain models, generate Python code, summarize results, or design experiments — but they’re not yet purpose-built forecasting tools.
For serious forecasting tasks, data scientists still rely on specialized time series models or emerging foundation models trained specifically on temporal data.
(See NeurIPS 2024 research for a head-to-head comparison of LLMs vs. classical forecasting models.)
6.2 Time Series Foundation Models (TSFMs)
A Time Series Foundation Model (TSFM) is like an LLM — but instead of learning from text, it learns from billions of time series across industries such as finance, healthcare, IoT, and climate science.
These models build a general understanding of how things change over time — including:
- Trends and seasonality
- Anomalies or sudden shifts
- Complex interactions among multiple signals
Unlike traditional forecasting (where you train one model per dataset), a TSFM can handle thousands of series at once, adapting to new data with little or no retraining.
Key Advantages of TSFMs
| Benefit | What It Means in Practice |
| Rapid Forecasting | Run instant “what-if” scenarios and future projections. |
| Scalability | Forecast thousands of sensors, stores, or customers at once. |
| Deeper Insights | Detect subtle patterns missed by smaller models. |
| Less Training Needed | Fine-tune quickly with less data and compute. |
| Efficiency | Faster deployment and simpler maintenance pipelines. |
TSFMs are to forecasting what GPT was to language — models you can prompt with data and get meaningful predictions directly.
6.3 Time Series Large Language Models (TSLLMs)
A Time Series Large Language Model (TSLLM) blends the reasoning ability of LLMs with the numeric focus of time series models.
They still use transformer architectures like GPT but are trained on sequences of numbers instead of sentences.
Think of TSLLMs as a bridge between ChatGPT and ARIMA — fluent in both language and time.
These models can:
- Perform conversational forecasting, e.g., “Forecast next month’s revenue for these three stores.”
- Explain anomalies in plain English (“Store B dropped 20% because of a public-holiday closure”).
- Handle multimodal reasoning, combining text with sensor or financial data.
Reference: Reference: “TSLLM: Time-Series Large Language Model,” arXiv 2402.01801“
Emerging Pre-Trained Models for Time Series
Here are some of the most promising pre-trained LLM-style models for time series analysis:
| Model | Description / Focus | Research Link |
| TimeLLM (Nixtla) | Adapts LLMs for time series forecasting through temporal tokenization | arXiv:2310.01728 |
| TimeCopilot | Multimodal time series assistant integrating LLM reasoning and forecasting | arXiv:2509.00616 |
| Chronos (Amazon) | Open-source foundation model for forecasting across domains | arXiv:2403.07815 |
| TimesFM (Google) | Foundation model trained on billions of time series; excels at zero-shot forecasting | arXiv:2310.10688v2 |
| Moirai (Salesforce) | Multimodal foundation model for predictive analytics | Salesforce Blog |
| TTM (Tiny Time Mixers) (IBM) | Explores hierarchical temporal reasoning | arXiv:2401.03955 |
| TimeGPT (Nixtla) | Commercial foundation model that performs forecasting through API | arXiv:2310.03589 |
Summary
LLMs like ChatGPT are fantastic companions for reasoning about time series — but they aren’t built to forecast them directly.
The real breakthrough lies in Time Series Foundation Models (TSFMs) and Time Series LLMs (TSLLMs), which merge the linguistic intelligence of LLMs with the mathematical precision of temporal model.
In the coming years, these systems will likely transform how we predict, detect, and explain change — across finance, climate, energy, healthcare, and beyond.
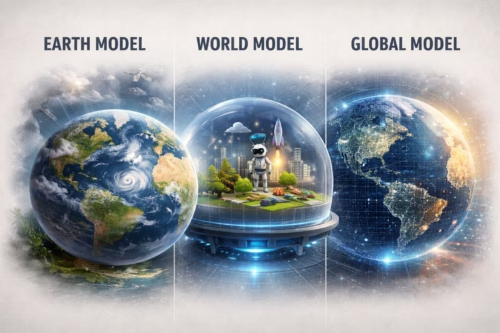
7. Global Models for Time Series
In the early days of forecasting, each problem was treated in isolation.
If a company had 1,000 products, it would build 1,000 separate models — one for each product’s sales.
This old-school approach is called a local or univariate model.
But in the real world, data often shares patterns — products spike together during holidays, or machines slow down in the same shift.
Wouldn’t it be smarter if one model could learn from all of them at once?
That’s the idea behind global time series models — the modern, scalable approach to forecasting.
Local vs. Global Models — The Key Difference
| Type | What It Does | Example | Limitation |
| Local / Univariate Model | Learns from one single time series | A model that predicts daily sales for Product A only | You need new models for Product B, C, etc. — time-consuming and data-hungry |
| Global Model | Learns from many time series together | A single model that predicts sales for all products in a store |
How Global Models Work
A global model is trained across multiple time series at once — think of data from several products, stores, or sensors feeding into one shared network.
Instead of memorizing a single trend, it learns common patterns across series, such as:
- Seasonality: sales rise on weekends or holidays
- External factors: weather, promotions, or economic cycles
- Interdependencies: if Product A sells well, Product B might too
Once trained, a global model can forecast all these series — and even make predictions for new series it hasn’t seen before.
Why Global Models Are Powerful
- Efficiency: One model replaces hundreds. It’s faster to train, deploy, and maintain.
- Better Generalization: By learning shared behaviors (like “weekend peaks” across products), it performs better — especially for series with limited data.
- Cross-Series Learning: Global models understand relationships between related series. Example: both Product A and B drop in sales when the store is closed on Sundays.
- Scalability: Perfect for large-scale forecasting — from every SKU in a supermarket chain to every sensor in a factory.
Examples of Global Time Series Models
Global models can come from both deep learning and machine learning families.
| Model | Type | Description |
| DeepAR (Amazon) | Deep Learning | Uses RNNs to model many related time series jointly. Great for probabilistic forecasting. |
| N-BEATS (Nixtla) | Deep Learning | Learns from multiple univariate series using shared layers. Simple yet powerful, with minimal tuning. |
| Temporal Fusion Transformer (TFT) | Deep Learning | Uses attention mechanisms to learn across many series and features — interpretable and scalable. |
| XGBoost / LightGBM | Machine Learning | Tree-based models that handle multiple time series when structured with time-based features. |
| Prophet (Facebook) | Additive Model | Can act as a global model when trained on grouped data, such as forecasts for multiple countries or stores. |
Why Global Models Are the Future
Global models are redefining how organizations handle large-scale forecasting.
They learn once and apply everywhere, discovering connections that individual models miss.
Whether you’re forecasting power demand across cities or predicting customer traffic across hundreds of stores, global models make it possible — efficiently and intelligently.
They’re also the foundation for foundation models like TimesFM and TimeGPT, which take this idea even further: training once on billions of time series to make universal forecasting accessible to all.
8. Preparing and Transforming Datasets for Time Series Models
Before any time series model — whether it’s a simple ARIMA or a complex Transformer — can make accurate predictions, the data must first be cleaned and shaped. This step is called time series preprocessing and transformation, and it’s as important as the model itself.
Why? Because real-world time series data is messy. It often comes with:
- missing timestamps,
- noisy or duplicated readings,
- irregular intervals, or
- values measured on totally different scales.
Preprocessing helps the model see the underlying patterns clearly — without being distracted by chaos.
Step 1: Preprocessing — Cleaning and Standardizing Data
Preprocessing means making your data consistent, continuous, and comparable before you feed it into a model.
| Step | What It Means | Why It Matters |
| Rescaling / Normalization | Adjusts all values to a similar range (e.g., 0–1 or z-score) | Prevents large numbers from overpowering smaller ones |
| Handling Missing Values | Fills gaps using interpolation, mean, or forward-fill | Ensures smooth, unbroken timelines |
| Smoothing / Denoising | Reduces random noise and fluctuations | Helps the model learn the true trend |
| Resampling / Resizing | Converts data into regular time intervals (hourly, daily, etc.) | Avoids uneven spacing between observations |
| Outlier Removal | Detects and limits extreme spikes | Prevents rare anomalies from skewing predictions |
Tip: Even small cleaning mistakes can cause big forecasting errors later. Always visualize your data — plot it before and after cleaning — to confirm nothing went wrong.
Step 2: Feature Extraction — Turning Raw Signals into Useful Information
Rather than feeding the entire raw series into a model, you can first extract key features that describe its behavior.
These features summarize important traits — like trend, variability, periodicity, or randomness — making the model’s job easier.
Here are three popular approaches:
1. Catch22 (CAnonical Time-series CHaracteristics)
Catch22 is a collection of 22 carefully chosen statistical features that describe a time series.
They include:
- Mean and variance (basic stats)
- Autocorrelation (how current values depend on the past)
- Entropy (complexity or randomness)
- Predictability and periodicity measures
Catch22 is fast, easy to interpret, and works beautifully with traditional ML models like Random Forests or XGBoost.
Fun fact: The “22” stands for the number of canonical features researchers found most informative.
2. ROCKET (RandOm Convolutional KErnel Transform)
ROCKET is a clever shortcut inspired by deep learning.
It applies thousands of random convolutional filters to a time series — like scanning it for shapes, slopes, and bursts — and then uses those results as features for ML models.
Think of it as borrowing the first layer of a neural network — but running it lightning-fast without complex training.
- Works for classification or regression
- Often matches deep networks in accuracy
- Trains thousands of times faster
Tip: ROCKET is great for beginners who want deep learning–level performance without needing GPUs.
3. SAST (Self-Attention-based Series Transformation)
SAST uses attention mechanisms (the same idea behind Transformers like GPT) to figure out which parts of a time series matter most.
Instead of manually engineering features, it learns to focus on the right time windows automatically.
That makes it especially useful for deep learning pipelines where interpretability and automation go hand-in-hand.
Step 3: Data Splitting and Sliding Windows
Most time series forecasting is supervised learning: you train a model to predict the future based on the past.
That means you need to turn your continuous timeline into input–output pairs — using something called a sliding window.
Example:
If you want to predict tomorrow’s temperature based on the past 7 days, each training example looks like this:
Input (past 7 days): [20, 21, 23, 24, 22, 23, 25]
Output (next day): [26]
Sliding windows “slide” across your data, creating many overlapping examples that the model can learn from.
Step 4: Data Transformation for Deep Learning Models
Deep learning models like RNNs, LSTMs, and Transformers expect structured, numerical sequences.
Here’s how to get your data ready:
- Shape: Time series data is stored as 3D arrays with shape:
(samples, timesteps, features). Example: (10,000, 30, 5) = 10,000 samples, each with 30 time steps and 5 features.
- Normalization: Neural networks are sensitive to scale — always normalize inputs (e.g., between 0–1 or z-score).
- Stationarity: If the series has a trend or seasonality, use differencing or detrending. Stable data makes models converge faster.
Why Preparation Matters
Think of preprocessing as cleaning the lens before you take a photo.
If the lens is dirty, even the best camera won’t give a clear picture.
The same goes for time series models — clean, structured data produces clear, reliable forecasts.
9. Anomaly Detection in Time Series
Not all data behaves the way we expect.
Sometimes, a heartbeat races, a machine overheats, or a sudden spike appears in your website traffic. These unexpected patterns — called anomalies or outliers — are the surprises hidden inside your time series.
Detecting them early can prevent fraud, system failures, cyberattacks, and even medical emergencies.
What Is an Anomaly?
An anomaly is simply a data point (or sequence of points) that behaves differently from the norm. It signals that something unusual — and possibly important — is happening.
Common causes include:
- Faults or malfunctions (sensor errors, equipment breakdowns)
- Real-world events (fraud, demand shocks, market crashes)
- Rare patterns (behaviors the system has never seen before)
In short, anomalies are the “plot twists” in your data — and time series analysis helps us catch them before they turn into crises.
Real-World Examples
| Domain | Example of Anomaly | Why It Matters |
| Finance | A sudden spike in credit card transactions | May indicate fraud |
| Healthcare | Irregular heart rhythm or oxygen drop | Could warn of a medical emergency |
| Manufacturing / IoT | Sensor readings rising sharply | May suggest machine failure |
| Cybersecurity | Unexpected network traffic or login attempts | Often signals intrusion or malware |
| Retail | Product sales suddenly drop to zero | Could indicate a stockout or data glitch |
For deeper insights, see the research survey on Time Series Anomaly Detection (arXiv).
Types of Anomalies in Time Series
Anomalies come in different shapes and contexts. Understanding their type helps you choose the right detection method.
- Point Anomalies
A single observation that stands out.
Example: A $10,000 transaction when normal spending stays under $500.
- Contextual Anomalies
The value itself isn’t strange — but the timing is.
Example: High ice cream sales in winter (unusual for the season).
- Collective Anomalies
A group of points forming an unusual pattern.
Example: A steady temperature rise over hours suggesting a machine is overheating.
The Anomaly Detection Pipeline
Here’s how anomaly detection typically works, step by step:
- Data Collection: Gather raw signals from sensors, logs, or transactions.
- Preprocessing: Handle missing data, smooth noise, and normalize values.
- Feature Extraction: Compute characteristics like seasonality, variance, and trend.
- Model Training: Teach a model what “normal” looks like.
- Detection: Flag data points or sequences that deviate from normal patterns.
- Evaluation & Feedback: Verify flagged anomalies and refine the model.
Think of it like training a security dog — it learns the usual sounds of the house so it can bark when something feels off.
Common Time Series Anomaly Detection Methods
| Method | Type | Description | Best For |
| Statistical (Z-Score, IQR, ARIMA Residuals) | Traditional | Flags values far from statistical norms | Simple, low-dimensional data |
| Isolation Forest | Machine Learning | Randomly splits data to isolate rare points | Tabular or aggregated time data |
| LOF (Local Outlier Factor) | Machine Learning | Compares local density of points to neighbors | Clustered or regional data |
| Autoencoder | Deep Learning | Learns to reconstruct “normal” patterns; errors = anomalies | Sensor or high-dimensional data |
| LSTM-based Detector | Deep Learning | Predicts future values and flags large deviations | Sequential or long-term data |
| Transformers / Attention Models | Deep Learning | Learns dependencies and subtle shifts across time |
Modern systems often combine these — using autoencoders or transformers for detection, and LLMs or TSFMs to explain the anomalies in plain language.
Why Anomaly Detection Matters
Anomaly detection isn’t just about catching errors — it’s about understanding change. It tells us when a system behaves differently, why that might be happening, and how to respond quickly. Whether it’s preventing a cyberattack, diagnosing a patient, or maintaining an aircraft engine — anomaly detection turns unpredictable data into actionable insight.
Further Reading
- Time Series Anomaly Detection Survey (arXiv 2024)
- AEON Toolkit – Anomaly Detection Examples
- Nixtla TimeGPT – Anomaly Forecasting
Final Summary: What You’ve Learned About Time Series
If you’ve read this far — congratulations.
You’ve just journeyed through one of the most fascinating branches of applied AI: Time Series Modeling — the art of understanding and predicting how things change over time.
Let’s step back and see how the pieces fit together.
The Big Idea
At its heart, time series forecasting is about learning from the past to make informed guesses about the future.
From predicting stock prices and weather patterns to monitoring heartbeats and factory sensors, time series models help us make sense of data that moves through time.
What You’ve Discovered
- What Time Series Forecasting Is (and Why It Matters)
You learned how time series differs from standard data — it’s sequential, dependent, and rich in patterns like trend and seasonality.
- Types of Time Series Problems
Not every problem is about forecasting! You explored classification, anomaly detection, segmentation, and clustering — each uncovering different insights.
- Core Techniques
You met the main families of methods — from forecasting and classification to similarity search — and saw how they fit real-world needs.
- Traditional and Machine Learning Models
You studied the classics: ARIMA, Exponential Smoothing, and SARIMA, then stepped into modern ML with Random Forests, Gradient Boosting, and SVR.
- Deep Learning and Pre-Trained Models
You discovered how neural networks — CNNs, LSTMs, Transformers — learn patterns automatically, and how pre-trained models like Prophet, TFT, and N-BEATS make forecasting faster and smarter.
- LLMs and Foundation Models for Time Series
You explored how models like ChatGPT are inspiring a new generation of Time Series Foundation Models (TSFMs) and Time Series LLMs (TSLLMs) — models that combine reasoning, forecasting, and explanation.
- Global Models
You saw how global models learn from many time series at once — scaling forecasting across thousands of products, stores, or sensors with shared intelligence.
- Preparing and Transforming Data
You practiced how to clean, standardize, and structure time series data — because even the best model can’t fix bad input. You learned about feature extraction tools like Catch22, ROCKET, and SAST that turn raw data into powerful signals.
- Anomaly Detection
You finished by learning how to catch surprises — spikes, dips, and unusual patterns — before they become costly problems.
The Road Ahead
Time series modeling is moving faster than ever.
The future belongs to foundation models that understand both text and time — capable of reasoning, forecasting, and explaining in one seamless workflow.
As LLMs evolve into temporal reasoning systems, you’ll soon be able to chat with your data — asking not only “What happened?” but “Why did it happen, and what might happen next?”
Whether you’re a student predicting exam scores, a researcher studying climate change, or a data scientist managing millions of sensors — time series AI is your crystal ball for understanding change itself.
Suggested Next Steps
- Hands-on Practice: Try building models using AEON Toolkit, Nixtla’s TimeGPT, or Google’s TimesFM.
- Learn the Math: Explore autocorrelation, Fourier transforms, and attention mechanisms.
- Experiment: Compare traditional models (ARIMA, Prophet) with modern architectures (LSTM, TFT, Chronos).
- Stay Curious: Read new arXiv papers and open-source repos — the field changes monthly!
Final Thought
Time series is more than numbers on a timeline — it’s the rhythm of life itself.
Every heartbeat, every sunrise, every market swing is a series waiting to be understood.
And now, you know how to listen.
Want to learn more about everyday use of AI?
Discover more from Debabrata Pruseth
Subscribe to get the latest posts sent to your email.